Most companies already have enough data. What they lack is the last mile: the stretch between the polished dashboard and the decision that actually changes something.
The number that best describes this problem appeared in a compilation of Gartner data published in 2026. 91% of companies say data-driven decisions are essential, but only 57% actually rely on their data to decide.
The gap between 91 and 57 is not a technology problem. It is a translation problem. There is information in the company and there are decisions in the company, but nobody built the bridge between the two.
There is also a counter-signal that helps calibrate the issue. In PwC’s 2026 Digital Trends in Operations survey of 767 operations leaders, 89% said actionable data matters more than comprehensive data, and 84% said they are comfortable deciding with imperfect information.
In other words: perfect data is not the obstacle. The obstacle is the absence of a method to turn what already exists into action.
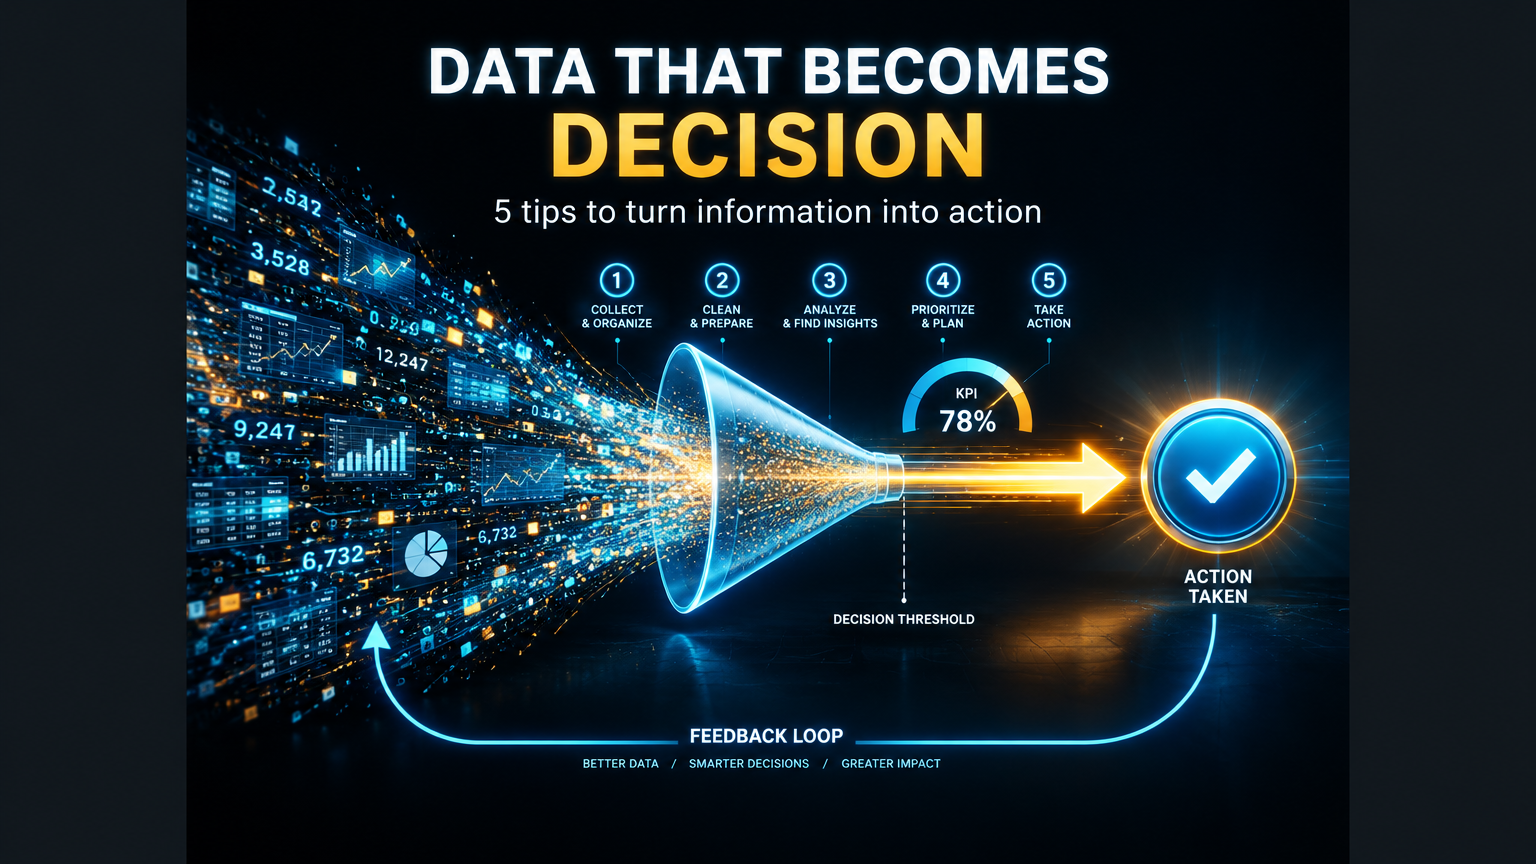
The five tips below target exactly that stage.
1. Start from the decision, not the dashboard
The most common mistake in data projects is starting with the wrong question: “what can we measure?”. The right question is: “which decision must this support?”.
Before building any report, write in one sentence the decision it is meant to feed. For example: “decide whether we increase stock of product X next quarter”. From there, the necessary data becomes obvious and, better still, the unnecessary data disappears.
This principle has a technical name in product engineering: start from the outcome and work backwards. Applied to data, it solves the problem of dashboards nobody opens. A panel without an associated decision is decoration with a maintenance cost.
2. One number per decision
Dashboards with forty indicators produce a curious effect: paralysis. When everything matters, nothing guides.
The practice that works is choosing one primary indicator per decision, accompanied by at most two or three guardrail indicators, the ones that prevent winning on one metric by losing on another.
A concrete example. To decide whether to hire another person in support, the primary indicator might be tickets resolved per hour. The guardrails would be the reopening rate and customer satisfaction. Three numbers, one decision.
Everything else is context, and context does not decide.
3. Set the trigger before you see the data
This is the step that separates companies that decide with data from companies that use data to justify decisions already made.
Before looking at the result, write the rule. “If conversion falls below 1.5% for two weeks, we increase investment in the channel that is working.” “If average delivery time goes past four days, we review the supplier.”
The rule written in advance has two virtues. The first is that it eliminates post-hoc rationalization, that moment when the number arrives and each person interprets whatever suits them. The second is that it turns data into a system rather than a debate.
The pattern is old and comes from science: define the criterion before seeing the result. It works because it stops the conclusion from choosing its own evidence.
4. Deliver the data where the decision happens
A monthly report that arrives three weeks after the problem is not information, it is archaeology.
The value of a data point is inversely proportional to the time between the moment it exists and the moment someone can act on it. That is why the goal must be putting the number where the work already happens: in the sales system, on the support panel, in the notification that interrupts someone in time.
This has a practical consequence many companies ignore. Building a better report is not enough, the flow has to change. And changing the flow requires automation, because nobody will manually check ten indicators every morning.
This is where intelligent automation stops being a technical luxury and becomes what makes data arrive on time. Automatic alerts, delivery at the right moment, a record of who acted and when.
5. Close the loop with the outcome
The fifth tip is the one almost nobody practises, and it is the one that turns data into learning.
Every decision made on data produces an outcome. That outcome must come back into the system as new data, and not vanish inside a meeting.
In practice: log the decision, the number that originated it, the expected result and what actually happened. Three months later, compare. Over time, the company builds something rare: the historical hit rate of its own indicators.
It is the full cycle. Data generates decision, decision generates outcome, outcome generates better data. Without that final turn, a company has dashboards but no intelligence.
And this requires an organized foundation. McKinsey’s State of AI 2026, with 1,719 respondents across 97 countries, shows a revealing picture: 80% report individual productivity gains from AI and 50% say AI helps them decide better, but only 37% report a positive contribution to their company’s financial result.
The gap between individual gain and organizational result is precisely the absence of this cycle. What each person learns about deciding stays unrecorded, and therefore does not accumulate.
Here, data science applied to business does the groundwork: organizing records, connecting scattered sources and ensuring the history exists in usable form. And a well-built digital structure, with defined fields and forms designed for real use, is what sustains that record over time.
Conclusion: data is only worth the decision it provokes
Turning data into decisions does not require more technology. It requires reversing the order of reasoning: start from the decision, pick one number, set the trigger before looking, deliver at the right moment and measure the outcome again.
The figures show that most companies have already moved past the collection phase. They have data, tools and reports. What remains missing, in 74% of cases according to the same Gartner compilation, is the link between what is known and what is done.
A competitor can copy your dashboard. It cannot copy the habit of deciding with it.
The question that remains:
How many decisions at your company last month were different because someone looked at a data point?
If the answer is “very few”, the problem is not the data. It is the bridge.